- For Linux & QT4: geomark/Linux-QT4/x86_64/Bin/QfwWellDataVizApp
- For Linux & QT5: geomark/Linux-QT5/x86_64/Bin/QfwWellDataVizApp
- For Windows & QT4: geomark/Win32-QT4/x86/Bin/QfwWellDataVizApp.exe
- For Windows & QT5: geomark/Win32-QT5/x86/Bin/QfwWellDataVizApp.exe
WellDataViz allows users to visualize well data (well logs, bore hole image, zones, etc) using cross plot and/or well log display.
WellDataViz provides following functionalities:
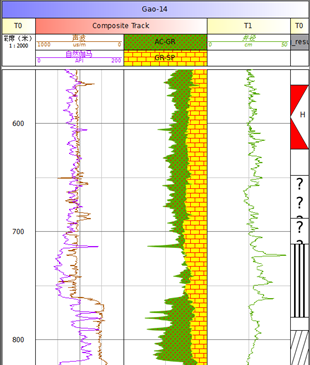
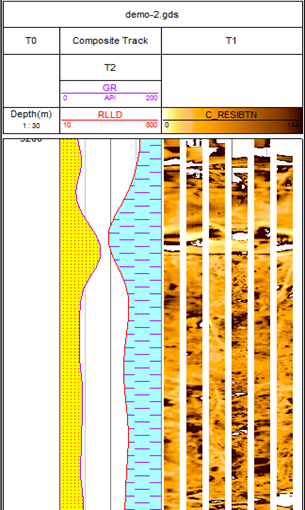
- Well log display
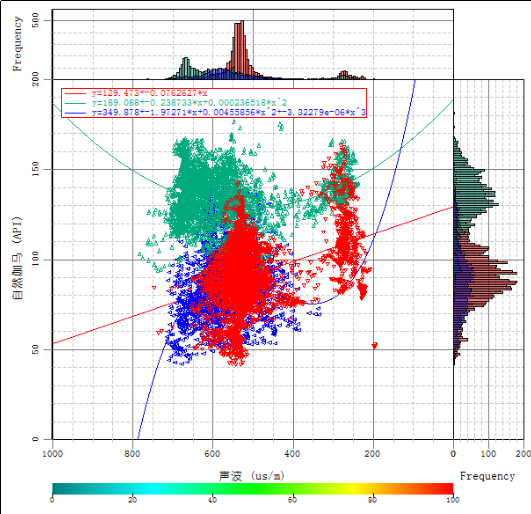
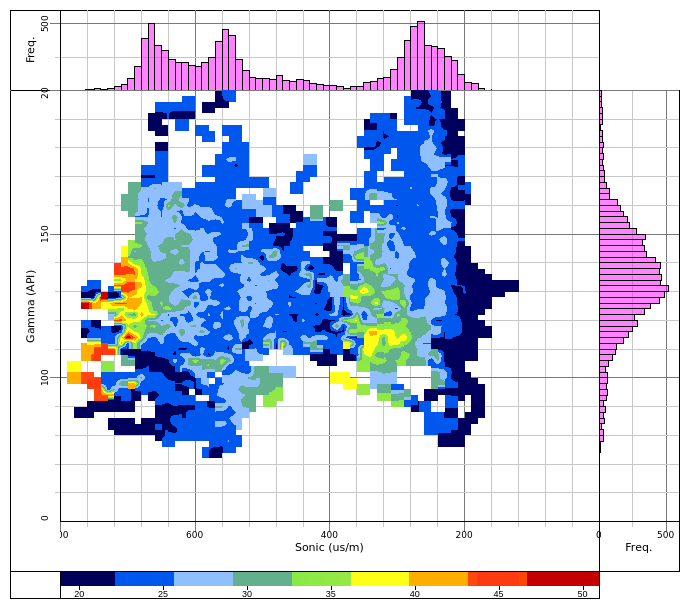
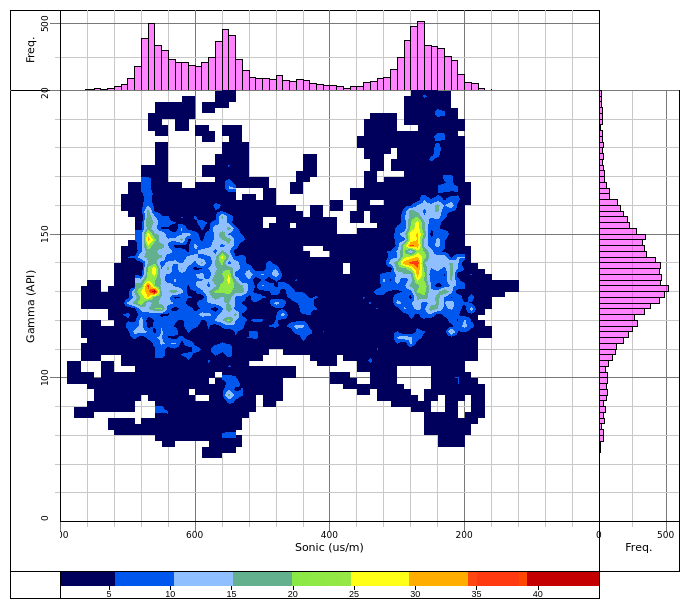
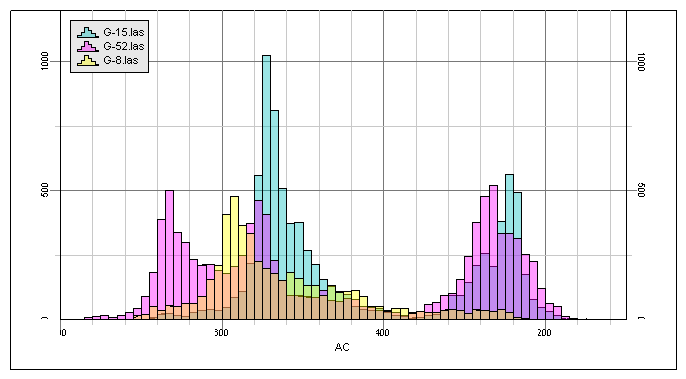
- Well log cross plot, z-plot, frequency plot, and histogram.
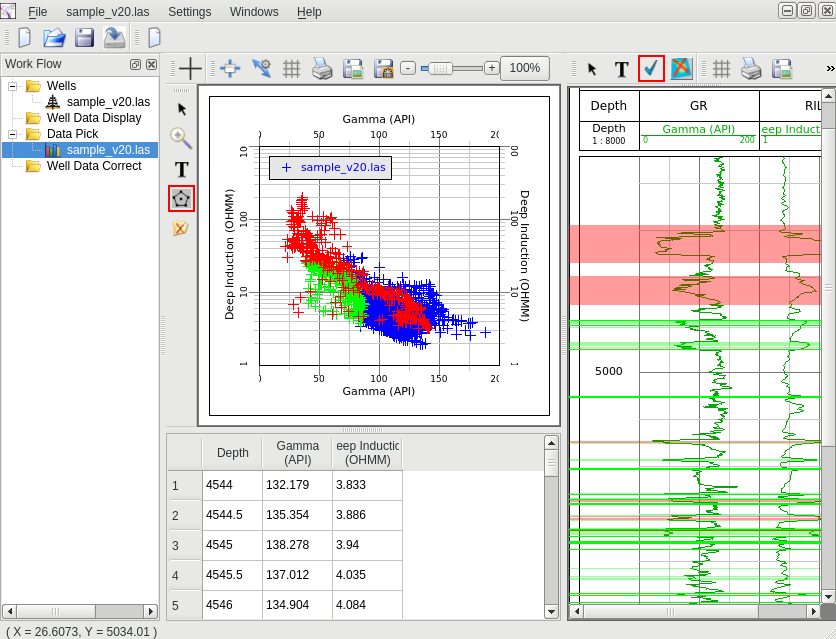
- Interactive well log data pick
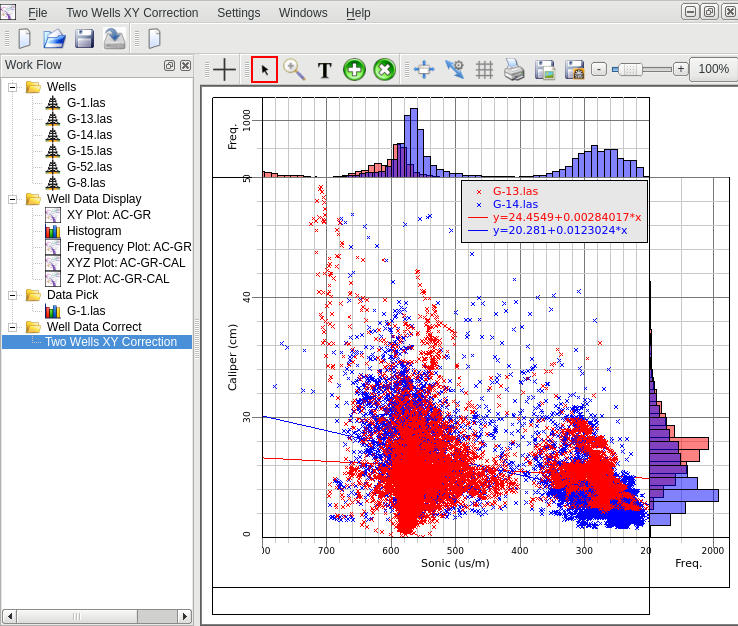
- Well log data correction
Features:
- Well log display: Well log display can be built interactively and saved as template to be used for other wells.
- Multi-wells cross plot
- Multi-wells z-plot
- Multi-wells frequency plot
- Multi-wells histogram display
- Interactive well log data pick: visualize well log data in 3 different views (cross plot view, log plot view, and table view), data picked in one view will simultaneously show up in other 2 views.
- Well log data correction: when well data are logged using different tools or at different time, there may be a systematic error between the logs. Correction is made by choosing one set of logs as reference to correct another set of logs. Automatic correction, manual correction, customized correction (A*X + B), and M/N correction are provided.